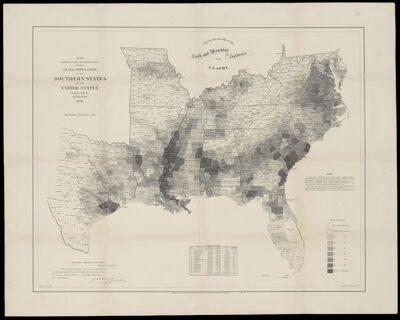
Map Showing the Distribution of the Slave Population of the Southern States of the United StatesCreator:Hergesheimer, Edwin Publisher:U.S. Coast and Geodetic Survey Date/Date Range Produced: 1861 Language:English Region Depicted:United States Dimensions: 1 map: 81 cm x 102 cm on sheet; 69 cm x 87 cm neat line Historical Context: Map depicts the uneven distribution of slaveholdings in the border and southern states. Each county is shaded to reflect the density of the enslaved population; the darker the county is shaded the higher percentage of enslaved persons with the darkest shade indicating counties in which more than 80% of the population was enslaved. LC Call Number: G3861.E9 1860 H4 OCLC: 43788003 Accession Number: OML-1861-126 Subjects:Civil WarSlave TradeSlavery
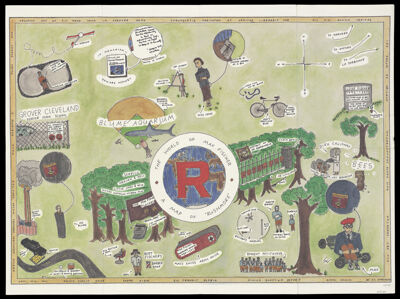
The World of Max Fischer: A Map of "Rushmore"Printmaker:Anderson, E.C. Language:English Map Type:Pictorial maps Dimensions: 34 x 49 cm on sheet 37 x 49 cm Historical Context: The map was published at the same time of Wes Anderson's movie "Rushmore". LC Call Number: G3201.E645 1998 A5 OCLC: 1396163769 Accession Number: OML-1998-94