In the sixteenth, and well into the seventeenth century, the course of ocean currents was virtually unknown. But as European ships left the familiar shores of continental Europe and their trade routes in the Mediterranean to venture out into the Sea of Darkness, or Great Green Sea of Gloom, as Arab geographers called the Atlantic Ocean, they encountered great rivers within the sea–the ocean currents. With an ever increasing number of expeditions to discover new lands and a sea route to the East Indies, mariners slowly accumulated new knowledge of these currents. Gradually, general patterns began to emerge. William Bourne, in his A Regiment for the Sea (1580), describes how the Portuguese in sailing toward the East Indies kept away from the westward setting Agulhas current off Cabo bone sperance (Cape of Good Hope) by sailing a hundred or a hundred and fifty leagues south of the Cape. On the return trip they made use of this self-same current to speed their passage by sailing close to the Cape. When they entered the northern Atlantic, mariners avoided the contrary setting Canary Current, and the Northeast Tradewinds, by making a wide sweep to the northwest until halfway to America, before setting a final course homeward. The Spanish also gained knowledge of this invisible mover of ships–the great clockwise gyre of water in the North Atlantic. On their way to the West Indies, Spanish ships sailed south past the Canary Islands, then turned west to take advantage of the westward flowing North Equatorial Current. Returning, they sailed north with the Florida Current (between the Bahamas and Florida) to higher latitudes, then headed homeward. Christopher Columbus followed this route on his voyages, but he attributed the favorable eastward set of the Gulf Stream to the effect of tides, rather than recognizing it as part of the continuous circle of current in the North Atlantic.
The British mapmaker, Carington Bowles, produced this chart in 1762 "to show the course of sailing from one continent to the other." Sailing from Europe, ships made a stop in the Madeira Archipelago or Canary Islands for final provisioning of food and water before heading south to pick up the Northeast Tradewinds. Then, they altered course to the west for the West Indies, Carolina and Virginia. The Northeast Tradewinds and North Equatorial Current always ensured a swift and dependable voyage. If headed for the port of Boston, or the cod fishing grounds on the Grand Banks of Newfoundland, they took a direct course in more northerly waters. As long as they did not wander too far south to encounter the Gulf Stream, ships made acceptable progress in the passage. On the return voyage, Portuguese and Spanish ships rode the strength of the Gulf Stream northward from Florida until they reached the latitude of Virginia. There, they turned east to sail directly to the Azores, and back to their home ports. The choice for an eastward voyage at this latitude was determined less by any knowledge of a favorable current, than fear of the risk of meeting with English or French vessels. With piracy and privateering the order of the day, any ship of another nation was considered fair prey. Euclid's theorem that "the shortest distance between two points is a straight line" obviously prompted the suggestion for the routes indicated for sailing from England to New York, or Virginia. But the shortest distance does not always equate with the shortest time. Ships sailing to New York had to battle against the prevailing southwest wind, as well as the Gulf Stream.
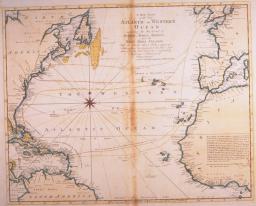
map/1945
Carington Bowles
English, 1724-1793
A New Chart of the Vast Atlantic or Western Ocean
Copper engraving, hand-colored, 44.7cm x 55.1cm
London, 1762
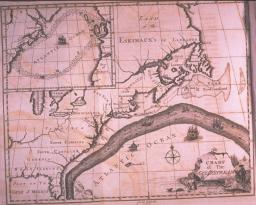
Early explorers of the North American coast were quick to note the Gulf Stream, with its swiftness of current, distinctive color and temperature. But it remained until nearly the end of the eighteenth century before the general path of the Gulf Stream was worked out, and realized to be one part of the large gyre of current in the North Atlantic. Two men, William De Brahm (Surveyor General of the Southern Coast of North America), and Benjamin Franklin, working independently both published charts showing the path of the Gulf Stream. Of the two, Franklin's chart is better known. As noted in 1606 by the French historian, Marc Lescarbot, the key to determining position of the Gulf Stream is the warmth of its water. During voyages taken in 1775, 1776, and 1785, Franklin took daily water-temperature readings. In 1786 he published the results of his research, with a new map of the Gulf Stream that is displayed here.
img/flat/nep11.jpg
Benjamin Franklin
American, 1706-1790
A Chart of the Gulf Stream
Copper engraving, 20.7cm x 25.5cm
In: Transactions of the American Philosophical Society, vol. 2 (Philadelphia: Robert Atkien, 1786)
Fully 104 years after Benjamin Franklin published the results of his study of the Gulf Stream, its position as charted by the U.S. Coast and Geodetic Survey remains virtually unchanged; testimony to Franklin's thorough and correct observations. The landward edge of the Gulf Stream, referred to as the North Wall, closely follows the 100 fathom (600 feet) curve, marked here with a continuous dotted line. Running less than a hundred miles offshore, one would believe that the Gulf Stream warms the east coast of the United States as it does for the west coast of the United Kingdom, Europe, and Norway. This would be true, but for two important considerations. Prevailing winds on this side of the Atlantic--the combined result of the Bermuda/Azores High Pressure cell, and the rotation of the earth--blow from the southwest. Blowing over the warm sea-surface of the Gulf Stream, these winds divert its benign heat away from the land and toward the sea. A cold water counter-current, running close inshore as far south as Cape Hatteras, creates an additional barrier to the Gulf Stream's heat reaching the shores of North America.

map/1053.0001
John Elliott Pillsbury, Lieutenant U. S. Navy, later Rear Admiral
American, 1846-1919
Chart of the Gulf Stream
Lithograph, 44.8cm x 34.2cm
In: United States Coast and Geodetic Survey, The Gulf Stream: Methods of the Investigation and Results of the Research (Washington: Government printing Office, 1890)
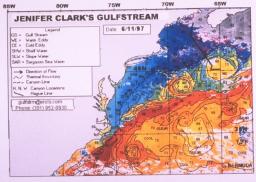
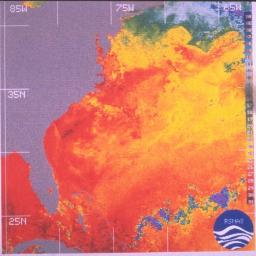
For twenty-six years Jennifer Clark was a professional satellite oceanographer for NOAA (National Oceanic and Atmospheric Administration). Now her work is available on a commercial basis to mariners, professional fishermen, and yachtsmen. Her charts combine infrared imagery with satellite altimetry data and surface isotherm lines to produce a clearly understandable chart of the Gulf Stream's boundaries and travel. Temperatures are in degrees Fahrenheit. Isotherm boundaries are included and arrows indicate the direction of flow. Occasional loops and swirls break off the main current to become self-contained eddies. Clockwise circulating Warm-core Eddies (WE) north of the Gulf Stream are represented in orange and yellow. Counter-clockwise circulating Cold-core Eddies (CE) south of the Gulf Stream are in light orange. Continental Shelf Water (SHW) is depicted in blue, and Continental Slope Water (CLW) in green. The blotchy white areas are caused by cloud cover preventing temperature sensing. Today, charts of the Gulf Stream, and all the major currents of the world, are prepared from satellite imagery, and made available daily to mariners by single side-band radio and fax transmission. Though the technology used to gather the data is much more sophisticated than in Benjamin Franklin's time, the principle has remained unchanged--currents are still measured by differences in temperature. Instead of a thermometer to take readings of surface water, infrared photographs are taken from satellites. These black and white images are then converted by arbitrarily assigning colors to different values of gray; alternately, differing values of gray are separated by isotherms--lines of equal temperature.
img/flat/nep13.jpg
Jenifer Clark
Jenifer Clark's Gulfstream 11 June 97
http://users.erols.com/gulfstrm/
This image used with permission.
Major surface currents of the North Atlantic: cold-water currents are indicated with dashed, blue lines; warm-water currents with solid, red lines. In its simplest form, the general surface current of the North Atlantic Ocean is one, large clockwise gyre. Divided into various segments, each current carries a different name and set of characteristics. The southern portion of this gyre is the North Equatorial Current, sweeps from east to west with a consistent set (direction) and velocity. Within its central axis the speed is about 0.5 knot. Upon reaching the Caribbean and Bahama Islands, it curves northward, where it is joined by the Florida Current originating in the Gulf of Mexico. These combined currents shoot through the strait between Florida and the western edge of the Bahamas to achieve a maximum velocity of 3.0 knots. Moving northward, paralleling the United States coastline, now properly called the Gulf Stream, it has a velocity ranging from 2.0 knots at the southern end to about 0.6 knot
img/flat/nep14.jpg
Rosentiel School of Marine Atmospheric Science
East Coast Direct Broadcast SST Image Daily Composite
University of Miami
[surface currents diagram]
http://www.rsmas.miami.edu/
This image used with permission.
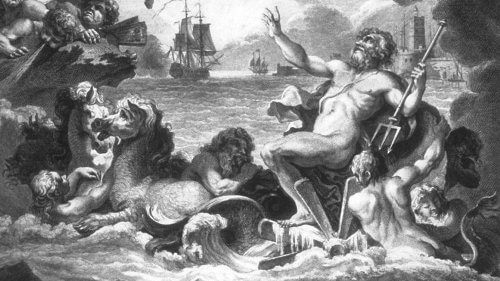
That tides (as distinguished from currents-tides occur in all oceans, whereas currents are limited to specific regions) are affected by astrological, or lunar, events was realized as early as the first century BC by Posidonius of Rhodes and affirmed a century later by Pliny the Elder in his Historia naturalis. In the early years of Christianity, Church Fathers rejected much of the intellectual and artistic legacy of Greece and Rome, along with its paganism. Yet they accepted the notion that the moon exerted a physical attraction on the ocean which somehow produced tides. The Venerable Bede, an early eighth century Benedictine scholar and historian, and other Christian scholars believed that the moon causes tides. Not all men of learning accepted this notion. The eminent Christian philosopher, Macrobius, who wrote during the late Roman Empire, thought that colliding currents produced tides. His geographical theories may have been borrowed from Homer's description of the ocean currents. Paul the Deacon (c. 725-799), a historian at the court of Charlemagne, attributed tides to gigantic whirlpools off the coast of Norway or Ireland. And in the twelfth century, Richard, prior of St. Victor in Paris, believed that the tides were produced by a great submarine monster. Explaining exactly how the moon acted to exert its influence on tides was much more difficult than stating the postulate. Not until the seventeenth century, with an understanding of the principles of mechanics of fluids, and of gravitational forces, was an answer provided.