About
Staff
Collections
Imaging Services
Donations and Gifts
Student Employment
Research Fellowships
History
Contact Us
Visit
Plan Your Visit
Directions and Parking
Research Visit
K-12 Field Trips
Group Tours
Teach
Book a K-12 Visit or Kit
Field Trips
Classroom Activity Kits
Downloadables
Professional Development
Mapmaking Contest
Summer Camp
Lewiston-Auburn Education & Community Map Lab
News & Events
Blog
Browse Maps
Exhibits and Reference
Gallery Exhibits
Map Commentaries
Digital Exhibits
Search Library Catalog
Digital Commons
Ask a Librarian
ADVANCED SEARCH
HOME
|
Tag Detail
About
Staff
Collections
Imaging Services
Donations and Gifts
Student Employment
Research Fellowships
History
Contact Us
Visit
Plan Your Visit
Directions and Parking
Research Visit
K-12 Field Trips
Group Tours
Teach
Book a K-12 Visit or Kit
Field Trips
Classroom Activity Kits
Downloadables
Professional Development
Mapmaking Contest
Summer Camp
Lewiston-Auburn Education & Community Map Lab
News & Events
Blog
Browse Maps
Exhibits and Reference
Gallery Exhibits
Map Commentaries
Digital Exhibits
Search Library Catalog
Digital Commons
Ask a Librarian
ADVANCED SEARCH
United States. Government Printing Office.
Showing 4-13 of 178 results
Sort By:
Relevance
Title A-Z
Title Z-A
Page 7
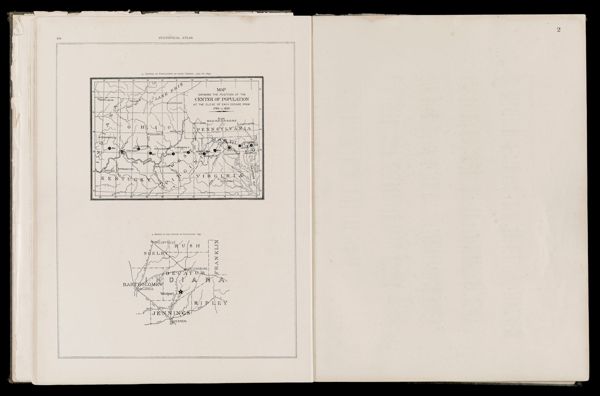
Center of population at each census: 1790 to 1890 / Sketch of the center of population 1890
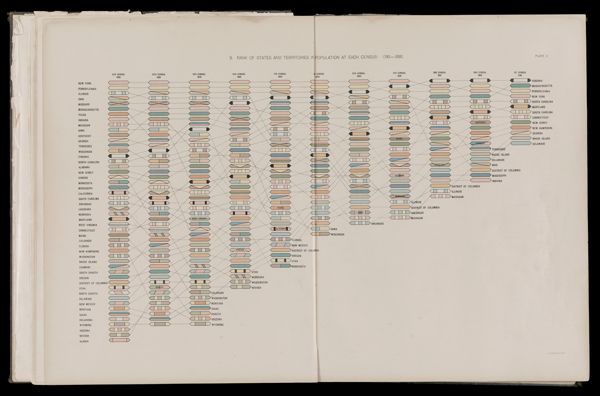
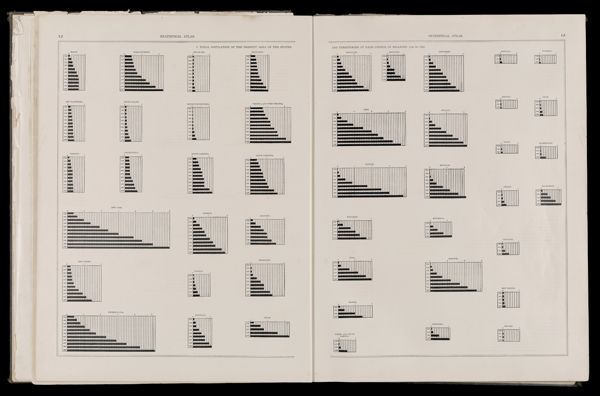
Rank of states and territories in population at each census 1790 - 1890
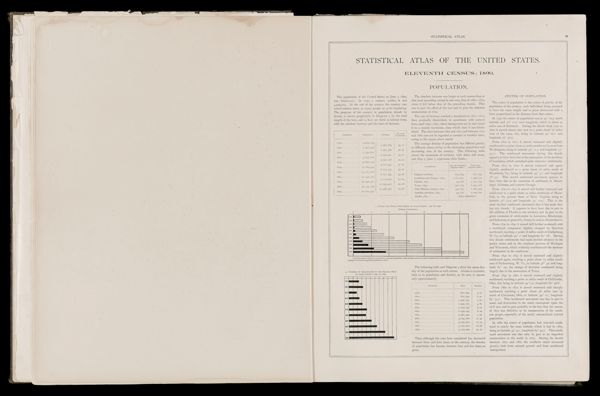
Population of each state and territory: 1890 / Number of inhabitants to the square mile, by states and territories: 1890
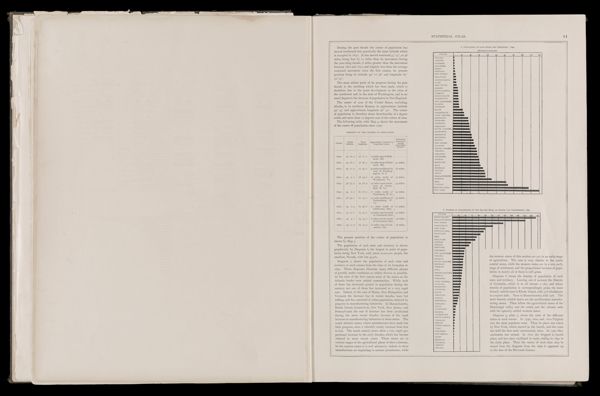
Total population of the present area of the states and territories at each census in millions 1790 to 1890
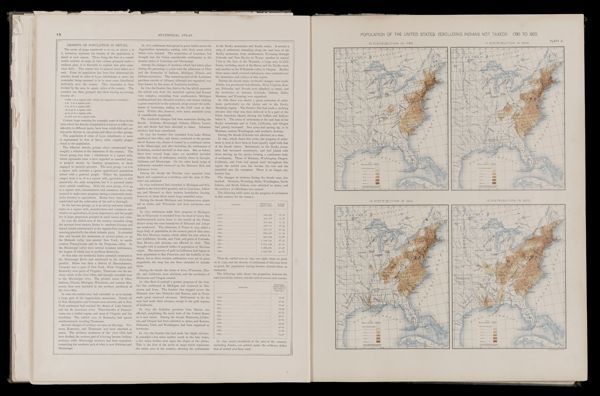
Population of the United States (excluding Indians not taxed) 1790 to 1820
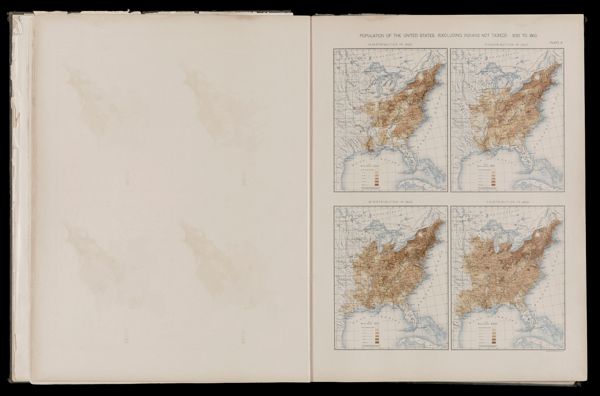
Population of the United States (excluding Indians not taxed) 1830 to 1860
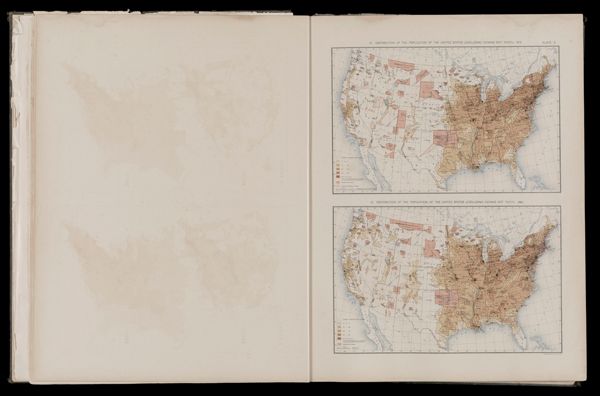
Distribution of the population of the United States (excluding Indians not taxed) 1870 / Distribution of the population of the United States (excluding Indians not taxed) 1880
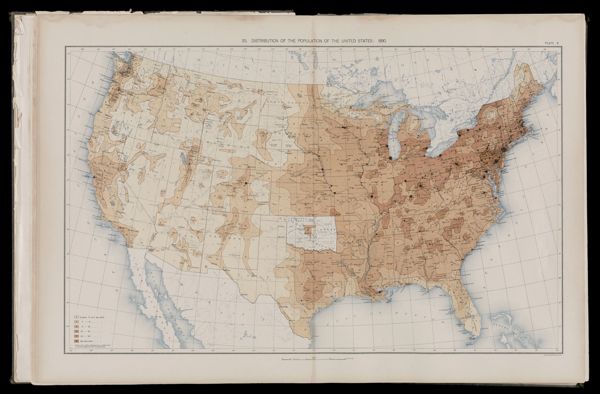
Distribution of the population of the United States 1890
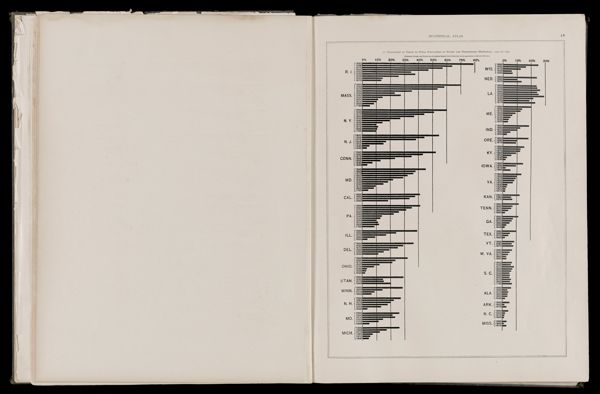
Proportion of urban to total population by states and territories - historical: 1790 - 1890
1
2
3
4
5
6
7
8
9
10
×
Basic Search
Advanced Search
Site Search
Keyword
Start Year
End year
Show only results with images
Exact match?
SEARCH
KEYWORD
TITLE
REGION DEPICTED
CREATOR/Printmaker
START YEAR
END YEAR
SUBJECT
BARCODE
Item Type
<select>
Artifact
Atlas
AV
Book
Document
Ephemera
Globe
Image
Serial
Sheet Map
Type
<select>
Account books
Advertisements
Advertising cards
Albums (books)
Ambrotypes
Astrolabe
Astronomical Models
Audio Discs
Audiocassettes
Audiotapes
Automobile License Plates
Baseball Caps
Bells
Board games (game sets)
Bookplates
Broadsides
Brochures
Bumper stickers
Business cards
Buttons
Calendars
Cameras
Campaign button
Card photographs
Cassette Tape
Celluloid Buttons
Certificates
Chinaware
Circular letters
Clippings
Clothing
Commonplace books
Compact Discs
Computer Programs
Containers
Cookie Cutters
Copybooks (instructional materials)
Correspondence
Cyanotypes
Cylinder Recordings
DVDs
Decals
Deeds
Diaries
Digital
Drafting Tools
Drawings
Embroidery
Envelopes
Family papers
Fans (ephemera)
Film Reels
Film negatives
Filmstrips
Game pieces
Gameboards
Games
Glass negatives
Greeting cards
Handkerchiefs
Hats
Invitations
Jewelry
Journals (accounts)
Keepsakes
Key chains
Landscape photographs
Lantern slides
Letterheads
Luggage tags
Manufacturers' catalogs
Manuscripts
Marbles (game pieces)
Membership cards
Membership certificates
Memorabilia
Menus
Microfilms
Model
Motion Picture Cameras
Needlepoint
Notebooks
Other/Unknown
Paintings
Pamphlets
Passports
Pencil sharpeners
Periodical illustrations
Phonograph Records
Photograph albums
Photographic postcards
Photographs
Photography Equipment and Supplies
Pictorial envelopes
Pin
Postage stamps
Postcards
Posters
Presentation albums
Price lists
Printing Equipment
Prints
Programs
Puzzles
Receipts (financial record)
Receipts (financial records)
Rewards of merit
Rolodex
Schedules
Scrapbooks
Sculpted Object
Sextant
Ships' logs
Signs
Sketches
Slides
Sound Recordings
Souvenirs
Stationary
Stereographs
Stickers
Surveying Tools
T-shirts
Tape Reels
Textiles
Tickets
Timetables
Tintypes
Title pages
Toys
Trade cards
Transparencies
Transportation tickets
Travel sketches
VHS
Videocassettes
Videodiscs
Viewbooks
Vinyl Records
Watercolors (paintings)
Wills
Writing Instruments
Map Type
<select>
Aerial photographs
Aeronautical charts
Astronomical charts
Bird's-eye views
Boundary maps
Braille maps
Cadastral maps
Celestial charts
Census maps
Chorographic maps
City maps
Climactic maps
Diagram
Digital maps
Engineering maps
Fire insurance maps
Geographical
Geological maps
Historical maps
Land use maps
Manuscript maps
Military maps
Nautical charts
Navigation charts
Panoramas
Pictorial maps
Political maps
Population maps
Portolan charts
Property maps
Railroad maps
Raised-relief maps
Relief maps
Road maps
Statistical maps
Tactical maps
Thematic maps
Topographical maps
Tourist maps
Transportation maps
Views
Wall maps
Zoning maps
Donor
<select>
470 Railroad Club
Acadian Archives
Achs
American Textile History Museum
Anderson
Antonacos
Arader
Arsenault
Auletta
Ball State University
Bangor Public Library
Baresei
Barthelman
Baskes
Bates
Bates College Library
Bean
Bellemere
Berkley
Bischof
Bloom
Bonebakker
Bouzrara
Bradt
Bresler
Bresloff
Brown, B.
Brown, H.
Buehler
Burns
CG
Callanan
Carhart
Carpenter
Cartmill
Chase
Chase Vinton
Chassé
Chazaud
Christian
Christoforo
Christopher
Clark
Colorado School of Mines
Corse
Cosgrove
Cotsen
Crawford
Croft
D'Anci
Dahl
Dale
Dalton
Dancause
Davis, G.
Davis, M.
Deering
Dodge
Donovan
Draper
Duclos
Dunn
EIS
Eastman
Eclectibles
Edney
Edward E. Chase Family
Eliot
Ellenberger
Elze
Engass
Epstein
Estate of Chester Chase
Ettenger
Farmington
Flaherty
Fleet Bank
Flowerdew
Flynn
Foster
Fowler
Freidman
French
Galvin
Gardner
Garland
Gibb
Gorham Library
Gould Cheseboro
Greater Portland Council of Governments
Green
Griffin
Gurtman
Hall
Hamill
Hamilton
Hamilton-Thayer
Hanly
Hardenbergh
Haupt
Hawes
Hermann
Hickey
Hirst
Hodges
Holland
Holmberg
Holtwijk
Hopewell
Hornsby
Horowitz
Horwitz
Houghton
Hovey
Howard
Howell
Hunt
Hunter
J. Moore
Jackson
Joel Osher
Jordon
Kaufman
Kaufman, R.
Kellogg
Kelly
Kelsey
Kendall
Knowlton
Kurtz
LaMonica
Lahti
Leboutillier
Levin
Libby
Library of Congress
Lindl
Lisberger
Lumbert
MacGregor
Maine Historical Society
Maine State Library
Major
Mann
Marci
Marsh
Matthews
Maxwell/Wheeler
McCrum
McHugh
McMahon
McMorrow
Meeker
Meinig
Meyer
Michie
Michigan State University
Mitchell
Monkhouse
Moore
Morelli
Morin
Morris
Morse
Mosher
Mountford
Naden
Nancy Lane
Nashville Public Library
Neikirk
Nelson
Neuschaffer
Newick
Nickerson
Nunley
Nutty
Nyberg
O'Brien
Osher
Osher Lifelong Learning Institute
Owen
Padula
Paine
Paradis
Patenaude
Peabody Museum of Archeology
Pendexter
Perry
Peterson
Picton
Pomeroy
Pope
Porobic
Pratt
Prieto
Pringle
Rea
Rees
Riback
Rice
Robinson/J. Walkling
Rockport Public Library
Ronan
Roos
Ruderman
Russell
Sandford
Sataloff
Sawyer
Seavey
Sewell Corp.
Shain
Sharp
Shettleworth
Simpson
Skiff
Skye
Smiley
Smith
Solomon
Sorin
South Portland Housing Authority
Spencer
Stead
Stephenson
Story
Thompson
Thompson Public Library
Tilton
Tomazin
Topol
Torodash
Town of Whitefield, Maine
Tremper
Tupper
Turner
UMaine Farmington Mantor Library
USM Franco-American Collection
USM Geo/Anthro Department
University of Maine Fogler Library
University of Maine Law Library
University of North Carolina
University of Southern Maine President's Office
University of Vermont, Special Collections
Usenik
Walkling
Waters
Webb
Webber
Weld Historical Society
Wendell-Thorpe
Whitman
Whitten
Willette
Williams
Williamson
Willson
Wind
Witham
Witty
Wood
Woodbury
Woods Hole
Wurtz
Yensen
Yorke
Language
Dedicatee
Editor/Translator
Publisher
Purveyor
Surveyor
Printing Process/Technique
<select>
3-D
Aquatint
Blueprint
Cerography
Digital
Electrotype
Engraving
Etching
Line Engraving
Lithograph
Mezzotint
Not Specified
Offset Printing
Relief
Relief Cut (facsimile)
Steel engraving
Stereotyping
Wood engraving
Woodblock
Aluminum
Copper
Copper Letterpress
Letterpress
Linoleum
Manuscript
Not Specified
Planar Surface
Steel
Stone
Wax
Wood
Wood Letterpress
Wood Letterpress Manuscript
Zinc
Material Type
<select>
Ceramic
Cloth
Copper
Glass
Leather
Linen
Metal
Mylar (modern drafting)
Newsprint
Paper
Papier mache
Plaster
Plastic
Rubber
Silk (textile)
Vellum (parchment)
Wood
Show only results with images
Exact match?
More +
less -
SEARCH
Keyword
SEARCH