
The third genre of printed urban maps of Portland from the antebellum era is something of a mixed lot, formed when a variety of people within Portland and from away sought to map the city in line with emerging national standards and practices among engineers and map publishers. We might therefore call this the “national” genre.
Two new conventions distinguish maps made within the national genre. First, trained engineers and map publishers working within a national market place adhered more strictly to the convention that north should be placed “at the top” of the map. For maps of Portland, this meant that the peninsula angled up from lower left to upper right. Pragmatic considerations led John Chace to the slightly rotate the peninsula back towards the horizontal, although not by much (Map 12); even so, Chace and those who copied from him continued to point the north arrow towards the top of the map, as if the map was properly oriented! Second, maps in the national genre identify places of interest by labeling them directly on the map and not with a numbered index set off in the Fore River. Together, these two strategies required maps of the city to have larger and squarer formats so that there was sufficient room to house the angled peninsula and to accept labels. Without the selection and hierarchical arrangement of key places, the maps made only little reference to the Portland civitas, the community; rather, they emphasized, in some cases almost exclusively, the built environment of the urbs.
[Lt. B. Poole, Map of Portland Harbor. Maine. Surveyed under the direction of Lt. Col. John Anderson, U.S. Top. Engineer … 1833, from Report of the Survey of Stanford’s Ledge, Portland Harbor, Maine, 1833, Congressional Series 259 (23rd Congress, 1st Session). Copper engraving. Osher Map Library and Smith Center for Cartographic Education, University of Southern Maine. OS-1833-5. Click on map for high-resolution image.]
One reason for the new conventions was the promulgation of new professional standards for mapping by civil engineers. By the 1830s, professionally trained civil engineers provided a significant proportion of the surveyors who mapped U.S. cities, counties, and states ~ in addition to military engineers, such as those who mapped Portland Harbor in 1832 ~ and they adhered to the standards they were taught. (There has yet been no analysis of the interrelationship of the professionalization of civil engineers and surveying practices in the U.S., although Nystrom [2014] makes a start in this respect, so this is a largely impressionistic statement that agrees well of the evidence provided by this mapping genre. At the very least, the abbreviation “C.E.” [civil engineer] becomes much more common after surveyors’ names on urban and county maps after 1830.)
A further reason was the increasing centralization of the commercial production of maps of all sorts, including urban mapping, in the major centers of New York and Philadelphia. With the complete integration of the interstate banking system, publishers in Philadelphia and New York were able to dominate book and map publishing. At the same time, the technology of lithography grew sufficiently inexpensive to permit the local production of maps for local markets, but that same cheapness also permitted a group of Philadelphia publishers to be competitive within multiple small markets across the country.
The urban mapping of Portland was thus increasingly undertaken either by people from away or by locals who nonetheless adhered to the same nationally adopted strategies, or both.
The market for urban maps of Portland continued to be Portland’s own populace, which still had little need for simple street maps. Portland was still a relatively compact walking city that was easily known even to visitors. Thus, when the first guidebook to Portland and surrounding area was published in 1859, its one map displayed the region rather than the city itself (Anon. 1859, 4).
The net result was that the national genre formed a rather disparate collection of urban maps that still sought to depict Portland’s built environment in such a way as to construe a civic community, but did so in quite a different manner than the booster and historical maps. As non-local map production displaced local production, local sentiment was subordinated to national mapping standards and the image of civitas was steadily down played.
The first civil engineer to map the city of Portland was James Hall. He is generally remembered today for his role in laying out the paths in the Western Cemetery, and also for his work in laying out new railroad routes, whether the Portland, Saco, and Portsmouth line (Hall 1836) or, in October–December 1844, the Portland–Montreal railroad (Baxter 1892, 249). The Maine Historical Society holds a couple of his detailed surveys: “Plan of James Deering’s Farm from a Survey Made by James Hall, C.E. Drawn by S. W. Eaton. 1843” (MHS map F 319) and also his “Plan of Land Taken by Order of Court, to Be Used in the Action, Deering vs. Ross” (1840; MHS map F 427).
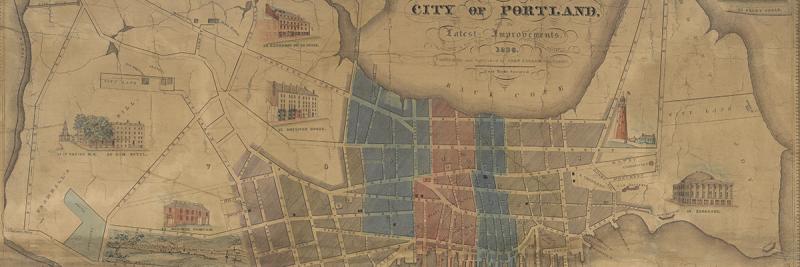
[Map 10. James Hall, Plan of the City of Portland From a survey made under the direction of the City Council by James Hall, C.E. Drawn by W.L. Dearborn & T. Quinby, 1837 Moores Lithy. Boston. Variant 2. Lithograph, 66 x 89 cm. Maine Historical Society, Portland. Map F 272 c.3. (Williamson 1896, no. 4121) Click on map for high-resolution image.]
Hall was commissioned by the city council to make a large survey and plan of the growing city, which was now spreading across both Munjoy and Bramhall hills. The city remained caught in the original boundaries of the town of Portland. One odd result of Hall’s sticking close to the city boundaries ~ other than his depiction of Forest and Bedford streets in Westbrook, which gave access to the “mainland” portion of the city ~ is that he did not extend the coast of the Back Cove around the title.
The result of Hall’s work was the largest printed plan of the city to date, smaller only than Lemuel Moody’s 1826 manuscript (Section 3). Rather than being copper-engraved, this large map was prepared in Boston by the firm of T. Moore’s Lithography. The 1830s was still an early period for lithographic printing, when the new process was still seen as producing “not reproductions but multiplied originals” (Twyman 2001, 6). In other words, this map was not a work to be sold commercially but a contracted work made, like a blueprint or Xerox copy, for in-house use.
Indeed, this rare map occurs in at least three variants, albeit with remarkably little difference between them. The first variant has 29 references in the index (Maine Historical Society F 272 c.1, which is not in good shape). The second has the same 29 references plus the addition of the label “Back Cove”; the label is placed quite far to the left, over what would have been land had the coastline been extended beyond the town boundaries, making it seem as if the cove actually covered areas of land. Impressions of this variant are Maine Historical Society F 272 c.3 (shown here), and a hand-colored impression (F 220) which is now in dire need of conservation. The third variant is marked by the addition of a 30th reference to the index. Maine Historical Society F 515 bears two sets of manuscript annotation: below the title is the single contemporary note “Mag. Variation 10º40½’ West in Octr. 1836”; across the map are several manuscript updates in the hand of Alexander Wadsworth Longfellow, dated November 1845. Other impressions of this third variant are F 272 c.2 and c.4, and the Portland Department of Public Works has a manuscript copy.
Being a local, Hall relied on some of the existing conventions for mapping the city. He placed the title in the Back Cove and, despite the map’s size, a list of indexed references in the Fore River. The references reiterate the hierarchy of importance established in the communal maps of the city: religious institutions; civic buildings; economic buildings.
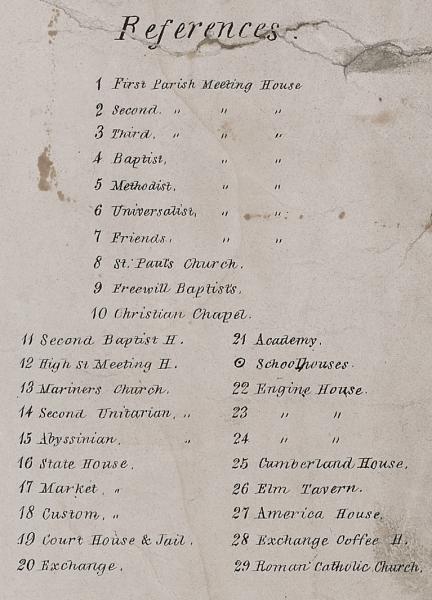
[Detail of Map 10’s references]
In the third variant of Hall’s map, a 30th reference was added for the “New Jerusalem Society,” and the building marked on Congress St., just across from the “Hay Scale Lot”
But there are also several striking differences between Hall’s map and the maps of the booster genre. Hall emphasized the land and downplayed the harbor by removing the opposite shore of the Fore River. He also changed the orientation of the peninsula, which now angles slightly up the page, but he did not orient the map with true north at the top; while this strange orientation was perhaps a product of his paper size, it certainly gives a sense of hesitancy about just how to depict the city, whether in accordance with communal tradition or national standards. At the same time, Hall’s north arrow showed both true and magnetic north, making a clear claim that the map was grounded in a survey. Furthermore, the scale, placed just below the north arrow, features transversals at either end, of the sort common on engineering plans as they permit map users to measure lengths with great precision.
Overall, Hall’s work is something of a transitional image, one that was still in part indebted to the genre of communal maps but that sought to apply the representational strategies of civil engineering.
That the urban mapping of antebellum Portland was closely tied to periods of economic growth and boosterism is evident from the fact that no new maps of the city were printed during the long recession initiated by the Panic of 1837, which lasted until 1844. Three directories were published during the economic downturn, in 1837, 1841 and 1844, but none went to the extra expense of including a map (Section 4). The city did not commission further surveys or an updated edition of Hall’s map. The recession has greater significance in that it conveniently marks the rise to dominance of the large Philadelphia and New York publishers, who were able to withstand the economic downturn because of their larger, multi-state distribution networks.
Moreover, Philadelphia’s role as a center of commercial lithography (Piola 2012), with presses powered by steam, enabled some of its publishers to develop by 1847 a dynamic system of creating, marketing, and distributing maps that sought to cater to the interests of local markets (Conzen 1984, 12–17; Brückner 2014). In its simplest form, local engineers and others were hired to map cities, towns, and counties; while they were working in each area, canvassers would collect subscriptions for the final maps; with enough subscriptions collected to meet the costs of creating the maps, the maps would be prepared and printed in Philadelphia; finally, the completed wall maps were delivered to the subscribers, with others being sold at higher prices (Harrington 1879). The process was largely seasonal: field work in summer and fall, production in winter, distribution and sale in the spring.
The new, commercial maps of counties were significantly different from the existing local, manuscript practices, in which surveyed maps of individual towns were compiled into county maps, as in an 1843 “Map of Somerset County.” By contrast, the new maps sought to depict dwellings and their interconnectedness and, in areas that had not been subject to survey and subdivision by the federal General Land Office, ignored property boundaries. The key feature of the new county maps was the inclusion of the names of the owners of each property, gathered by the surveyors as they passed houses or from tax registers. (But the maps were not made to assist in taxation and as such should not be called cadastral maps; it is more meaningful to call them “landownership maps.”) Rural areas were then suffering significant stress from encroaching industrialization and from fears engendered by a new wave of immigration, in the face of which the new maps construed each county as a civitas, as a coherent community. They used property ownership as a marker of individual social standing between neighbors. They gave insets of villages, lists of local business owners who had subscribed (“business cards”), population statistics, religious affiliations, and so on. For a large subscription fee, an individual could have a vignette of their home or place of business added to the map, shifting the work’s emphasis from the community to the celebration of individual success (Lyon-Jenness 2008; Theriault 2014).
This national genre in local mapping is relevant here because it was also applied to cities and significant urban places, and as such was the foundation for the mapping of Portland after 1850. But the appeal of such maps to civitas was necessarily less effective than for rural areas, for the simple reason that it was infeasible to name the owners of each and every building in a city. The Philadelphia-based entrepreneurs nonetheless sought to apply the same commercial and production strategies to cities.
The most important national entrepreneur to organize the detailed, local mapping of towns, cities, and counties in the northeastern states was certainly Henry Francis Walling (Buehler 2008). After the Civil War, his advocacy in Massachusetts would be instrumental in promoting the first federal-state topographical mapping program, in 1884–88 (Walling 1886). But in the 1850s, he organized a wide range of local surveys across the northeast.
[Map 11. Henry F. Walling, Map of the City of Portland Cumberland County Maine from Original Surveys Henry F. Walling Civil Engineer 1851. ([Philadelphia], 1851). Hand-colored lithograph, 74 x 88 cm. David Rumsey Collection. 1145.000. Click on map for high-resolution image (and then search for 1145000).]
One of Walling’s earliest projects was a new map of the city of Portland, known in just one surviving impression that is in quite poor shape. (Wall maps are notoriously difficult to preserve.) It also lacks any mention of the people who actually printed the map, but the work was undoubtedly accomplished in Philadelphia.
Preparation of the map was advertised in the Portland Daily Advertiser in 12 September 1850. The advertisement placed the map within national mapping traditions even as it sought to relate the work to the concerns of the local populace in order to solicit subscriptions (“encouragement”):
New Map of Portland.—We are informed that a very large and accurate map of Portland, is in preparation by H. F. Walling, Civil Engineer. It is to be so minute in the details as to shew every building and giving the names of the principal owners. It is to be accurately drawn from scale by actual measurement.
The draught will be exhibited to our citizens in a few days for examination and careful revision before engraving [sic] in order to ensure the most complete accuracy. The map will be beautifully got up and mounted on rollers. This is a work which is very much needed and if correctly got up we hope it will be liberally encouraged.
The advertisement, written as if by the newspaper proprietor but undoubtedly provided by Walling, was repeated in the Portland Advertiser on 17 September 1850. The map’s publication was announced on 10 March 1851:
The New Map of Portland, by Henry F. Walling, is published, and the agent is delivering them to subscribers—and has a few, we believe, for sale. It is very handsomely got up; designates the boundaries of the several wards, as recently laid out, and other late changes, and we are inclined to think is generally correct.
Note that the claim in the first advertisement, that the map would show the names of property owners, was dropped, presumably because it proved impossible to actually do so. It is also worth comparing these advertisements to those for Cullum’s 1836 map (section 5). Then, Cullum was selling his maps himself; now, the Philadelphia-based Walling had an agent to sell the maps. But the goal was still the same, to appeal to the sentiments of Portland’s inhabitants.
Yet Walling met local concerns by using national rather than local conventions. Most obvious, his map lacked either a compass rose or simple north arrow, and is oriented with true north at the top, as general cartographic standards required. The peninsula therefore runs diagonally across the page and, to fit the paper while maintaining its common engineering scale of 1 inch to 400 feet (or 1:4,800), breaks through the top margin. Note also that this spatial frame encompasses a portion of the opposite shore of Cape Elizabeth, which is dutifully detailed, as if the surveyor had cookie-cut a neat rectangle out of the world. Moreover, Walling has placed the title not in the Back Cove but across Westbrook. Finally, this is the first map of Portland since Barnes’ original map to lack an indexed list of references; rather, as the advertisements had indicated, each prominent building is labeled. Here is the area around the intersection of Congress and Brown streets, with the Wadsworth-Longfellow House as an unlabeled square:
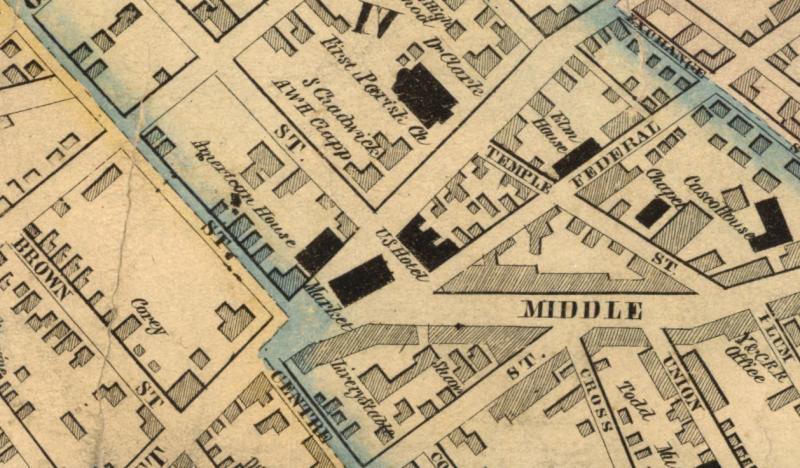
[Detail of Map 11.]
At the same time, Walling did tailor the map to local interests. As the advertisements mentioned, he colored the wards. He included three vignettes, in the manner common to this publishing model: two residences, those of S. L. Carlton (a daguerotypist and leading citizen) and James B. Cahoon (mayor), and also what is labeled the “New Custom House.” The last should properly have been called the “Exchange,” as it appeared for example on Cullum’s 1836 map; it would be destroyed in the great fire of 1866. I am unsure why Walling referred to this grand building as the “New Custom House,” although it did then house Portland’s customs office.
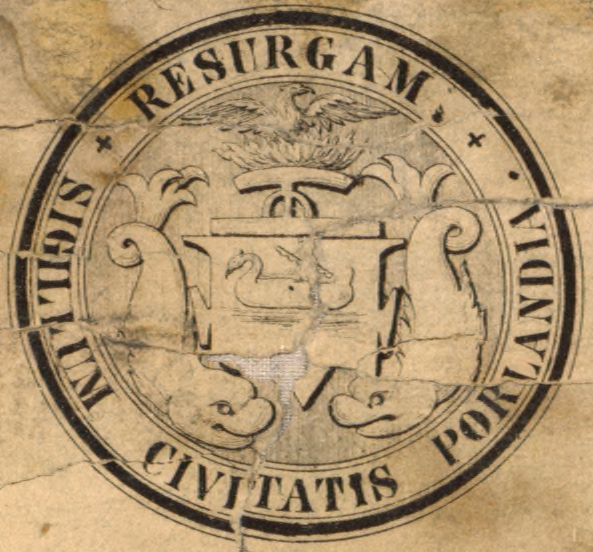
[Detail of seal on Map 11.]
Finally, Walling added a small figure to the title, specifically an image of the city seal. This would seem to be the earliest surviving delineation of the city seal, with the motto Resurgam and the phoenix above the shield with its Viking ship. (See Barry 1979 for later images of the city’s seal.) The seal and the vignette of the exchange point to an attempt to curry favor with the locals by referencing civic pride. But this is the limit to Walling’s imaging of the civitas.
The rest of the map has none of the flavor of a local product; it has no hierarchically arranged list of references to highlight Portland’s morality and religiosity, its commitment to education, or its civic virtue. Overall, Walling’s great map of 1851 remained the product of someone from away who came to Portland, surveyed the urbs, latched onto a couple of obvious things about the community, yet remained committed to national conventions for engineering surveys.
As Walling turned his attention after 1856 to mapping Maine’s counties, he was joined by another entrepreneur, one “J. Chace Jr.” Not much is known about Chace. Conzen (1984, 16) reliably specified his first name as “John.” He would seem to have been more of the on-site organizer and agent in Portland than an actual publisher: the misspelling of his name as “Chase” on a few maps seems to suggest he was not closely involved in their preparation and printing. In this respect, while we might refer to “Chace’s plans,” we should remember that the overall enterprise was his, but the actual surveys and designs were undertaken by specialists.
Compared to Walling, Chace was a lesser player. Yet his seven wall maps of Maine counties, with one exception (Somerset, 1860), addressed the state’s more populated and more economically developed counties: Androscoggin, 1858; Cumberland, 1857; Kennebec, 1856; Sagadahoc, 1858; Waldo, 1859; and York, 1856. Subsequently, in 1861, Chace and Walling collaborated in assembling all the county maps into a single map of all of Maine, together with a “business directory” that listed all the subscribers to the state map, by county and town (Chace 1861).
[Map of Cumberland County Maine from Actual Surveys by Sidney Baker C.E. and Others | J. Chace Jr., Publisher. 1857 | 53 Exchange St Portland | 517, 519 & 521 Minor St. Philadelphia. Hand-colored lithograph, 139 x 98cm. Osher Map Library and Smith Center for Cartographic Education, University of Southern Maine. OML-1857-14. Click on map for high-resolution image.]
Chace’s 1857 wall map of Cumberland County is no different in overall style from the other wall maps of Maine’s counties. In addition to the map of the county, with landowners carefully identified, the map was filled with a rich array of village insets, lists of businesses, and vignettes of residences. Among the insets was one of the city of Portland:
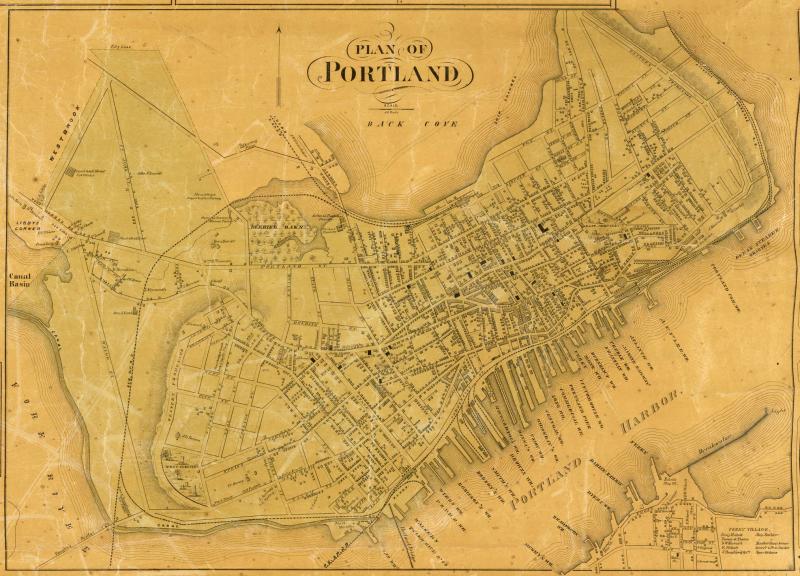
[Map 12.1. Detail of “Plan of Portland” on Chace’s Map of Cumberland County (1857)]
Overall, this inset map of Portland adhered to the conventions of the national genre of urban mapping, although with a few compromises to accommodate the creation of the larger map.
To design the whole work as efficiently as possible, its creators ~ still anonymous ~ organized all the inset plans, vignettes, lists of businesses, and title block around Sidney Baker’s survey map on a loose grid, which in turn required each individual element to be prepared within a rectangular frame; as the design progressed, unused corners could be cut off from some insets to make them fit. The last components to be fitted, other than the decorative border, were perhaps the lists of businesses, which could be used to fill in irregular spaces between the map and the grid of insets. This was particularly the case with the large list of Portland businesses that was prepared as a separate element, actually placed on a different sheet to that bearing the inset map of Portland:
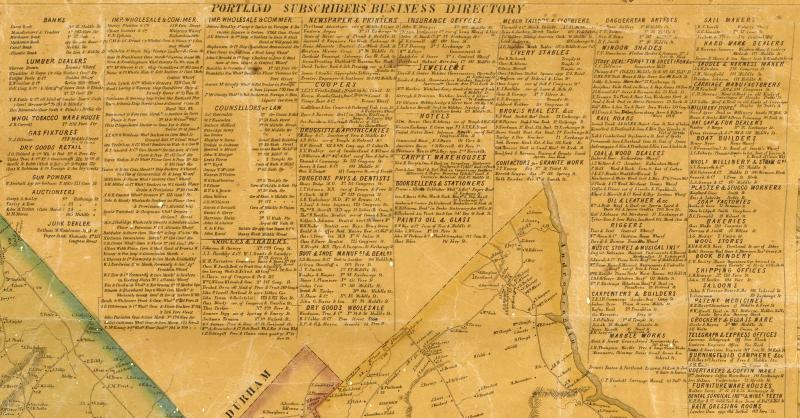
[Detail of “Portland Subscribers Business Directory” on Chace’s Map of Cumberland County (1857). The line running just above the title of the directory is the junction between two sheets.]
For the inset of Portland, this structural design process meant that the plan of the city had to be fitted within a rectangle. To do so, to make most efficient use of the allocated space, the map’s designers did not think to adopt the same orientation as the communal and historical genres, with the shoreline along the Fore River running horizontal across the bottom of the rectangular frame. No. They clung to the standard of engineering mapping, of north at the top. But if they really placed north at the top, then it would have been hard to fit the entire city within the predefined rectangle. So, they changed the orientation from true north, just enough, and trimmed off the tip of Munjoy Hill. And to assure readers that they were in fact adhering to convention, they added a prominent north arrow to proclaim that North is, in fact ~ really, trust us, we’re engineers ~ at the top. Even though it was not! (Compare the angle of the peninsula on the to that on the main map or on the 1851 Walling map.) The salient point here is that the production team in Philadelphia remained committed to the national standards. Indeed, given the limited circulation of maps in earlier decades, there is no reason to expect the Philadelphia team ever to have seen any of the maps from the communal or historical genres; of course they sought to adhere to national conventions.
The orientation of the peninsula left a small portion of Cape Elizabeth within the frame of the inset, which happened to embrace one of the small villages on the further side of the Fore River; the designers accordingly included the small list of businesses in “Ferry Village” within the inset as well.
A further idiosyncrasy of the inset plan is its depiction of the city’s open spaces, of the cemeteries and the park of Deering Oaks, then still held by the Deering family but treated as a public park (Holtwijk and Shettleworth 1999, 77):
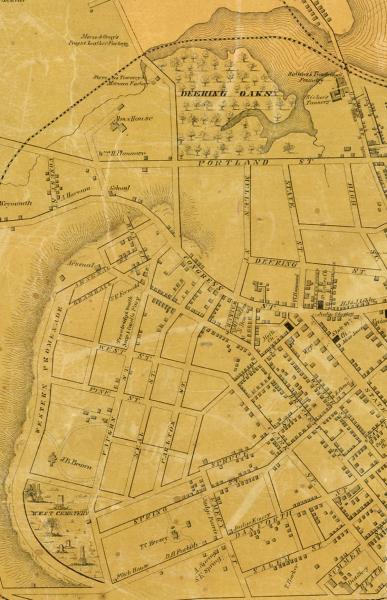
[Detail showing open spaces on the inset plan of Portland on Chace’s Map of Cumberland County (1857).]
The combination of inset plan, the list of businesses, and also vignettes of large homes and businesses on Chace’s county map presented Portland as a vibrant, active, and growing community, and as a major element in the life of Cumberland County. The communal sentiments were however rather generic: they did not rely on a presentation of local civic and communal institutions, as maps in the booster genre did, and they were also being construed for other cities in the northern states. But they did promote the town and would have made the county map attractive to residents.
[Map 12.2. Plan of Portland | Geo. R. Davis & Bros. 53 Exch. St. Portland | J. Chace Jr. Publ. 53 Exch. St. Portland 1858 | Wm. J. Barker & Co. Lithographic Engravers & Map Publishers No. 23 N. 6th. St. Phila. Hand-colored lithograph, 30 x 44 cm. Maine Historical Society. Map FF 310. (Another copy is map F 449.) Click on map for high-resolution image.]
Because of the relative ease to preparing images for transfer to lithographic stones, it was possible to reuse designs, with or without modification. This was the case for the inset plan of Portland: Chace reused the original plan for a separate publication in 1858. It seems that some additions were made to the original plan and the result transferred to a new stone, to which the neatline and imprint in the lower margin were then added. This argument reflects the manner in which the many new details on the 1858 separate plan are all additions, whereas none of the details on version 1 of this map were deleted in the preparation of version 2. (One result of this was the retention of the otherwise anomalous list of business in Ferry Village on the shore of Cape Elizabeth.)
Without the long list of Portland businesses that had originally accompanied the map in its first appearance on the county map, the 1858 map has to work to make any reference to the civitas, to make it a marketable product to the local populace. Two of the three sets of added content ~ in addition to some new labels for a few businesses ~ accordingly addressed a different element of the community.
First, the imprints of the publishers and printers involved in making and selling the separate map, both beneath the title and in the lower margin; the address of the publishers is the same as for the map of Cumberland County, but a different printer was used.
Second, the boundaries and numbers of the city’s wards, which were then colored, as explained in the small key added just to the left of the title, indicative of the city’s political structure as an incorporated city.
The third set of additions drew attention to the growth and success of the port, having reached sufficient size to require spatial regulation. Some depths were added in the Fore River, as also explained in the key, together with two mostly straight lines: on the Portland side of the river, “Commissioners Warf [sic] Line”; on the Cape Elizabeth side, “Warf [sic] Line.” These last lines had been defined in 1854 ~ when city officials had drawn them on an impression of the U.S. Coast Survey’s “preliminary chart” of the harbor from the same year ~ in order to limit future physical expansion of Portland’s wharfs so as not to hinder navigation in the harbor (Anon. 1855). The report itself contained a large map of the coastline and coastal features that had been traced from the Coast Survey chart by Alexander D. Longfellow in January 1855, that left the city itself an almost complete blank (Anon. 1855, after 14), while the accompanying statistical account contained a regional map of Maine in the context of New England the Maritimes to indicate the city’s growing rail connections (Poor 1855, after 50).
While the city’s wards were perhaps de rigeur for a map of Portland by this date, the addition of the wharf lines to Chace’s plan were distinctive and were presumably the immediate cause for Chase to think that there would be a local market for an urban map otherwise strongly lacking in representation of civitas.
Throughout the 1850s, the city directories continued to include maps of the city printed from the copperplate first used in 1827 (section 4). The publishers of the directory for 1858–59 evidently decided to take advantage of the appearance of the appropriately sized inset on Chace’s wall map of Cumberland County, to have a derivative lithographic copy made with which to replace the old copperplate:
[Map 13. Plan of Portland. 1858. | J. H. Bufford’s Lith Boston. Included in Beckett (1858). Lithograph with manuscript annotations, 31 x 43.5 cm. Maine Historical Society. Map FF 336. Click on map for high-resolution image.]
The map was prepared by the Boston lithographer, John Henry Bufford (1810–1870) (Tatham 1976), who had a long history of preparing graphics for Portland publishers. Just in terms of books mentioned elsewhere in this study, he had reproduced on stone J. K. Vinton’s panoramic view of Portland used as the frontispiece to the second volume of William Willis’s History of Portland (Willis 1831–33, 2: opp. [3]), and he had prepared the portraits of the Revs. Thomas Smith and Samuel Deane in the 1849 edition of their journals (Smith and Deane 1849, frontispiece, 288). In 1855, he also prepared and printed J. B. Bachelder’s panoramic view of Saco and Biddeford, a precursor to the bird’s-eye views of American cities and urban places that would proliferate after the Civil War (see Reps 1984).
That this new map was copied from Chace’s plan is evident from the orientation of the peninsula and from the loss of the tip of Munjoy Hill at Tukey’s Bridge. The lack of any indication of the city’s wards strongly suggests that it was specifically copied from the inset on the wall map of Cumberland County (Map 12.1). Bufford’s copy focused on naming the streets and wharfs and on showing the railway lines looping around the peninsula. It excluded the footprints of any buildings, except for the railway depots. The escarpments at either end of the peninsula are indicated but no other relief is indicated. All told, the map shows the bare minimum of information needed for a directory.
Bufford’s map is quite denuded of all the features that had been used on previous city maps to construe an identity for Portland as civitas, and also of almost all of the features that had been used to construe an identity for Portland as urbs. The map is not completely empty, of course, but it is sufficiently stripped down for it to be used as an almost neutral base on which others might construct new identities. And this is indeed what we find happening.
Impressions of the map in the 1858 directory were uncolored, but the particular impression reproduced here has been annotated by an owner, who used watercolor lines to delineate the boundaries between the city’s fourteen school districts, and he used ink to number the districts and to mark the location of the schools. The annotations were probably made by Rev. William H. Shailer (1807–1883), pastor of the First Baptist Church (1854– 1877) and long-time school board member. (The map’s verso bears the annotation, “Owned by the Rev. W. H. Shailer | Gift of the Rev. Shailer Mathews, his grandson, Jan. 1920.”)
For some reason, perhaps cost, S. B. Beckett’s next city directory (Beckett 1863) dropped Bufford’s large map and replaced it with a small and tecnically quite anomalous map:
[Map 14. Plan of Portland. 1863. Included in Beckett (1863). Wood engraving, 14.5 x 24 cm. Osher Map Library and Smith Center for Cartographic Education, University of Southern Maine. OS-1863-12. Click on map for high-resolution image.]
The map differs from all the other maps of antebellum Portland by having had its voids printed, so that it appears white-on-black. This was the same printing technology that the same publisher, Brown Thurston, had used for the small regional map included in the first guidebook to Portland and surrounding area just a few years earlier (Anon. 1859, 4). That technology was likely wood engraving; Thurston is remembered as the first printer to introduce wood engraving, together with other relief printing methods of stereotyping and electrotyping, into Portland (Anon. 1901, 38).
In wood engraving, the artist cuts into the hard end-grain of a piece of wood, which is then printed in a normal letterpress, so that the surface of the wood carries the ink; the result is a white-on-black image. In this case, the map would be drawn right reading, then placed face down on the wood. If the map had not been drawn on oiled paper (an early kind of drafting film), then the application of varnish would make the paper transparent. The engraver then simply cut into the wood along the lines of ink. The result looks quite different from most wood engravings of the era, which used closely spaced, alternating white and black lines as a means to recreate lights and shadow in artistic vignettes. The map is a much simpler graphic, with large areas of black ink whose mottling suggests the textured surface of the end grain.
It is possible that other techniques might have been used. It might have been made by photolithography: lay the manuscript map, drawn wrong reading, atop a light-sensitive resist on a lithographic stone; exposing the resist to light would make it insoluble so that it will take ink, so the voids between the lines will print black. The mottling of the ink, in this respect, would be explained by a pattern to the resist. Or, the map might have been printed as a blueprint, although that technique was only just coming into widespread use (Murray 2009) and I doubt it would be used so early for a print run that would presumably have been in the hundreds. Both of these techniques would, however, have required Thurston to invest in new printing technology. It therefore seems most likely that Thurston filled the breach in a supply of maps from Bufford, or a hole in his finances, by making the map in-house as an inexpensive wood engraving.
Much less needs to be said about what the map showed. In terms of its content, the map seems to have been copied from Bufford’s 1858 map (Map 13), but is even more tightly cropped to fit the small paper size. It maintains the pseudo-North orientation of the Bufford and Chace maps, and more of the tip of Munjoy Hill has been trimmed off. No thought was apparently given to rotating the peninsula on the page to permit it to be shown more completely. In this respect, and in its plainness, it belongs within the national genre.
The great fire of July 4th, 1866, destroyed much of the peninsula, cementing the city’s already well-established identity as a phoenix. It was the occasion for Bufford to make a new map to publicize the extent of the devastation:
[Map 15.1. Plan of Portland. 1866. | J. H. Bufford’s Lith Boston. Overprinted (red) title: The Great Fire at Portland July 4th. 1866. | Published by the Bufford Brothers Boston and New York & S. B. Beckett Portland. Separately published. Two-color lithograph, 30.5 x 43.5 cm. Maine Historical Society. Map F 587. Click on map for high-resolution image.]
This map was issued, as the overprinted imprint suggests, as a news sheet in Boston and New York, as well as in Portland itself. The seller in Portland was S. B. Beckett, author of the directories. In Boston and New York it was the “Bufford Brothers”; given that John Henry Bufford is not associated with a brother, I have to presume that this refers to his sons, Frank G. and John Henry Jr.
The significance of the overprinting is actually quite limited. It denotes a simple fact about the urbs of Portland. It only connotes some element of civitas when read in the context of Portland’s long-standing self-image as a phoenix, repeatedly rebuilding itself from fire and destruction. To the map’s presumed readers in Boston and New York, the map would certainly have signified tragedy, but little else. But to Portland readers, it embodied the city’s self-image of communal indomitability. And, in this respect, the 1866 map has necessarily been a key element in 150 years of exhibitions on and writing about the fire.
The map itself was a fairly close copy of Bufford’s 1858 map, fractionally reduced in size, and executed in a more refined manner. The parallel lines marking the water are drawn less haggardly than on the 1858 map, and many of the text labels are drawn with curved baselines that give the map a more elegant feel. A few changes were made in content: the Oxford Canal is shown ending at Vaughn’s Bridge and not continuing along beside Canal Street (now Commercial Street). But, once again, there was no attempt to reorient the map from the pseudo-north introduced by Chace in order to make the peninsula better fit the city. Reference should also be made to a copy issued, perhaps originally in a directory, to gauge from the fold lines, without the overprinting (Maine Historical Society Map FF 338).
Also in 1866, Beckett reused the map, with the slight addition of an East-West line to the north arrow, for the next issue of the city directory:
[Map 15.2. Plan of Portland. 1866. | J. H. Bufford Lith Boston. In Beckett (1866). Lithograph, 30.5 x 43.5 cm. Osher Map Library and Smith Center for Cartographic Education, University of Southern Maine. OS-1866-19. Click on map for high-resolution image.]
Cite This Page
Edney, Matthew H. “National, Engineering Mapping.” Section 7 of “References to the Fore.” Online exhibition, https://oshermaps.org/special-exhibition/references-to-the-fore. Published, 1 July 2017.